Survey: Mecklenburg seen as generally welcoming

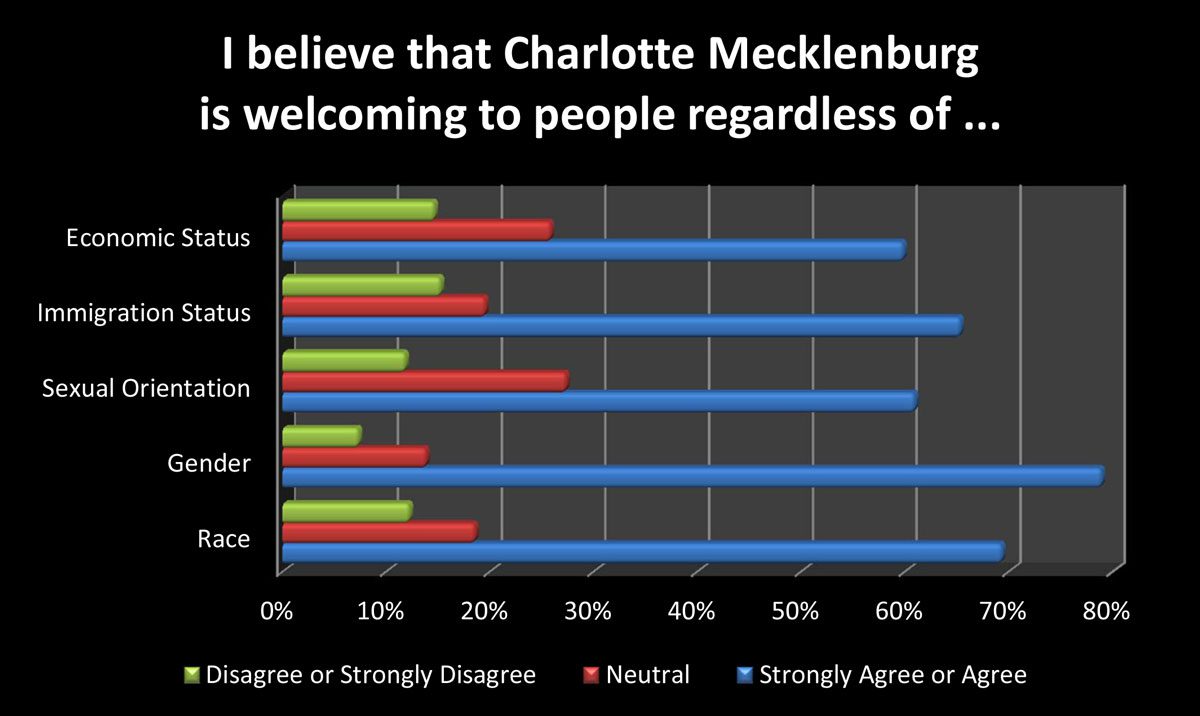
Is Mecklenburg County a welcoming place? Most people here think so, according to a survey from the UNC Charlotte Urban Institute. A majority of the 400 Mecklenburg County residents surveyed agreed or strongly agreed with five separate statements about Charlotte’s welcoming of people regardless of gender, race, sexual orientation, immigration status or economic status.
But some results varied depending on who was answering. Although 65.4 percent agreed or strongly agreed that Mecklenburg is welcoming regardless of someone’s immigration status, and 19.3 percent were neutral, Latino/Hispanics were more likely to disagree or strongly disagree (19 percent), and 31 percent of Hispanic/Latinos responded as neutral.
Learn more about the surveyThe institute’s Charlotte-Mecklenburg Annual Survey is accepting questions now. Click here to learn how your organization can participate. |
Late last month, the Charlotte City Council approved creating a 25-member Immigrant Integration Task Force, charged with integrating immigrants into local civic and educational organizations as well as improving relations between recent immigrants and the police force.
The Community Building Initiative (CBI), a Charlotte nonprofit that promotes inclusion and equity among groups, sponsored the survey questions on the UNC Charlotte Urban Institute’s Annual Survey in May and June.
“We want Charlotte to be an inclusive community for everybody,” says Valecia McDowell, CBI board member and former board chair. “Part of this is measuring where we are. We wanted to get some baseline data to know how our citizens and residents feel about how they are treated and how they treat others. We felt like no publicly available source of data captured that.”
The largest percentage of people (78.6 percent) agreed or strongly agreed that Charlotte-Mecklenburg is welcoming to people regardless of gender. Homeowners, full-time workers and those with household yearly incomes more than $40,000 were more likely to agree with the statement. Neutral responses made up 13.9 percent of the sample, while 7.5 percent disagreed or strongly disagreed.
“That’s consistent with what we’ve heard in the community,” McDowell said. “(Gender disparity) is an issue we’ve been working on for a long time.”
The question of whether the area is welcoming to people regardless of economic status drew the smallest percentage of people (59.9 percent) agreeing or strongly agreeing. Those who agreed or strongly agreed with the statement were more likely to be homeowners and make more than $80,000 per year. More than one-fourth (25.8 percent) responded as neutral and 14.3 percent disagreed or strongly disagreed.
The focus on economic status is relatively new for CBI. Originally focused on race and gender, the organization expanded its mission in 2011 to include issues of class and sexual orientation. McDowell says broadening the focus has helped the group understand more complex problems that may be caused by more than one issue.
“We want to look at the places where these differences intersect,” McDowell says. “If you take the issue of affordable housing – we were originally looking at that through a racial lens, and of course there is a racial component to it. But the more we dig into this, the more clear it is to us that that is a multifaceted issue. And it may be that the socioeconomic difference becomes the primary difference for that situation. So we keep teasing through the data.”
The question that drew the second highest percentage (69.2 percent) of respondents agreeing or strongly agreeing was whether Mecklenburg County is welcoming to people regardless of race. Results showed 18.4 percent were neutral and 12.3 percent disagreed or strongly disagreed.

“I think that there is some amount of disconnect (between the results) and some of the anecdotal information we’re seeing. But I’m thrilled with progress.” McDowell says. “All things being equal, that’s what we want to see.”
McDowell says the data on race relations can be useful in tracking the Charlotte area’s reaction to racially polarizing events, such as the September shooting of Jonathan Ferrell, a black man, by a white Charlotte-Mecklenburg police officer, Randall Kerrick. The survey questions were asked in the spring, before the shooting.
“I wonder if we had taken that survey two weeks after that young man was shot, whether we would have seen differences in that data,” McDowell says. “As that trial plays itself out, I’ll be curious to see if there will be changes.”
The statement about sexual orientation yielded the most neutral respondents (27.3 percent). Most respondents agreed or strongly agreed (60.8 percent) that Charlotte is welcoming to people regardless of sexual orientation; 11.9 percent disagreed or strongly disagreed. Males, renters, full-time workers and unmarried respondents were more likely to agree with the statement. The survey did not ask respondents about their sexual orientation, so the results don’t distinguish differences between LGBT and non-LGBT respondents. The survey does not ask about respondents’ sexual orientation because obtaining a large enough sample to distinguish differences between LGBT and non-LGBT respondents would require more resources than the survey had.
“I don’t know how many members of the LGBT community were represented in the responses,” McDowell says. “When that issue began to present itself in the form of Amendment One, those both within the LGBT community and outside the community had a real challenge reconciling their feelings around that issue. A number expressed real feelings of alienation. It’s hard to gauge how that is playing that out.”
The issue of same-sex marriage drew attention in North Carolina in 2012 when Amendment One reached the ballot. By 61 percent to 32 percent, N.C. voters approved the measure, which amended the state constitution to prohibit same-sex marriage or civil unions. Mecklenburg County was one of only eight mostly urban counties to vote against the amendment.
McDowell says the results are encouraging overall. CBI is also looking into getting information about how people in different neighborhoods feel about the community’s ability to welcome different groups.
“I’m always relieved to see that the community is at least perceived as welcoming,” McDowell says. “It’s hard to tease out what differences of viewpoint exist between where people live. The general opportunity and resources available can be dramatically different (between neighborhoods). We’re going to try to identify some of those differences.”
Brief overview of annual survey service and methodology
The institute’s Annual Survey obtained telephone interviews with a representative sample of 400 people ages 18 and older living in Mecklenburg County. Interviews were conducted via landline (n=320) and cell phone (n=80) by a national survey firm contracted by the institute. The interviews were administered in English and Spanish from May 9 to June 7, 2013. Statistical results are weighted to correct known demographic discrepancies. The margin of sampling error for results based on the complete set of weighted data is +/- 4.96 percentage points. For this article, most response categories were often combined to ease the presentation of survey results to readers.[1]
Respondents were asked to rate whether they agree or disagree with the statement using a scale of 1 to 5, on which “5” means they strongly agree and “1” means they strongly disagree. For ease of analysis, these responses were collapsed from 5 categories into 3 categories so that “1” means strongly disagree/disagree, “2” is neutral, and “3” means strongly agree/agree.
[1]A number of demographic categories were collapsed, such as employment status into employed full-time and not-employed full-time; marital status into married and not married.