Building? Demolitions? Explore neighborhood data

Did you know…
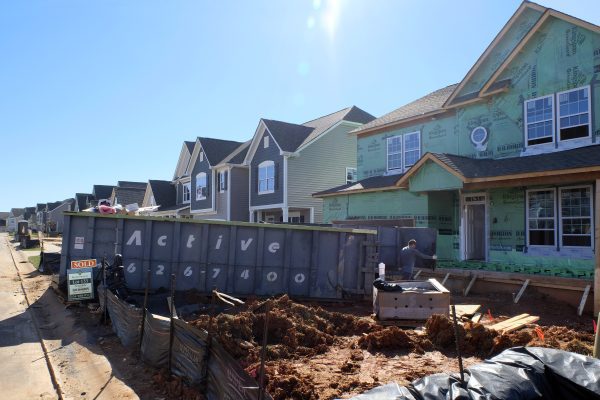
- 10,390 new housing units got permits for construction in Mecklenburg County between July 1, 2016, and June 30, 2017. That’s up 35 percent from the year before.
- 77 percent of Charlotte-Mecklenburg Schools students attended their neighborhood (assigned) school in the 2015-16 school year. In many neighborhoods, nearly all children attend their neighborhood school, but for several neighborhoods, the share was less than half.
- About 18 percent of the land in Mecklenburg County is vacant. Land is considered vacant if it has no existing structure or land use. In most neighborhoods, less than 10 percent of the land area is vacant. However, in a handful of neighborhoods more than half the land is vacant.
- In the last six years, Mecklenburg County has seen an increase of nearly 4,000 acres of impervious surface. An impervious surface is any hard surface that water can’t penetrate, such as a rooftop, driveway, sidewalk, patio or parking lot. One inch of rain on a single acre of impervious surface creates 27,000 gallons of storm water runoff.
All of this information (and much more) can be found on the Charlotte-Mecklenburg Quality of Life Explorer, a community data resource with a wealth of data on the social, housing, economic, environmental and safety conditions in Charlotte and Mecklenburg County neighborhoods. The Quality of Life Explorer is a collaborative effort of the UNC Charlotte Urban Institute, the City of Charlotte, and Mecklenburg County, with support from the six towns and numerous community data partners. The institute’s primary role is to maintain and update the data and provide technical assistance and outreach.
The project dates to the early 1990s, when it was named City Within A City and focused on conditions in Charlotte’s central neighborhoods and published the information every two years in a printed report. The project has evolved and grown over the years, and starting in 2012, information was made available for all Mecklenburg County neighborhoods and became accessible through an interactive web dashboard.
The Quality of Life Explorer website was recently redesigned, adding new data, and is more mobile-friendly. Twenty indicators have updated data, and one indicator has been added – residential demolitions.
You can learn, among many other things:
- How much water your neighborhood consumes compared to others.
- Which neighborhoods are experiencing the most commercial construction.
- How student absenteeism varies across neighborhoods and why it’s an important indicator of student success.
- Voter participation rates in your county commissioner district over several election cycles, and where to register to vote or volunteer to be a poll worker.
Learn more about this project here.
WHERE WERE NEW RESIDENTIAL CONSTRUCTION PERMITS ISSUED 2016-17?