Home values in region: Clusters of highs, lows

How much are homes in your neighborhood worth? The era of upside-down mortgages and foreclosures has left homeowners across the country anxious about home values – their own and their neighbors’. In the midst of this housing market upheaval, explosive growth in the Charlotte region has reshaped residential patterns.
Clusters of higher-value homes now stretch north and south of Charlotte, extending beyond the city and core metro county – especially into Union, York, Cabarrus and Iredell counties. Lower-value homes are concentrated across a band within Charlotte, showing clear zones of home values falling well above or below the median for the county overall.
These geographic patterns of housing values reflect increased economic segregation. This is a national issue recently explored by the Pew Research Center, among others. Although Charlotte was not part of Pew’s study, southeastern metros were found to be the least segregated by income, nationally. Even in the Southeast, however, the trend was toward more segregation by income.
The following maps show housing values by census tract across the 14-county Charlotte region. Each map shows the distribution and concentration of homes by price range, using the recently released American Community Survey five-year estimates from the Census Bureau.* Click on the buttons above the map to see maps showing different housing value ranges. (Maps showing median home values and a reference map of the region are available at the end of the article.)
Home values
$50,000 to $99,000$100,000 to $149,000$150,000 to $199,000$200,000 to $299,000$300,000 to $499,000$500,000 to $999,000$1,000,000+

Notes: Zones without color shading are nonresidential areas such as the airport and large industrial tracts. Data reflect owner-occupied housing units.
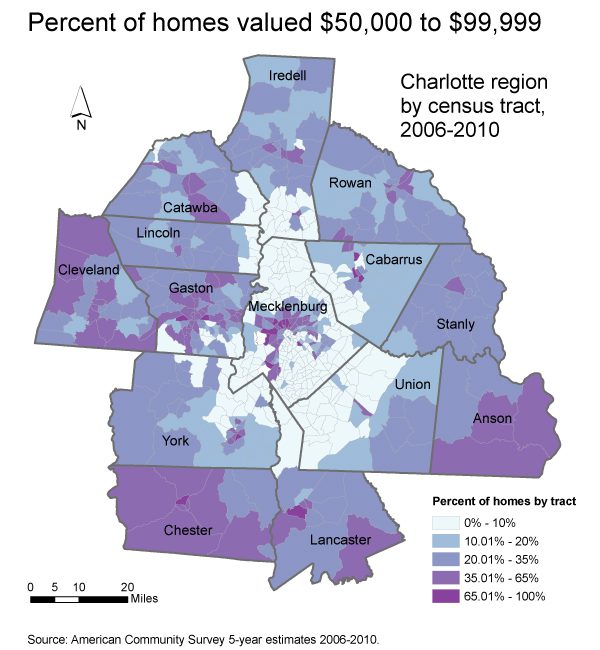
The map of home values between $50,000 and $99,000 shows that the homes in this range are more prevalent in an arc from southwest to north Charlotte in Mecklenburg County but are virtually absent anywhere else within Mecklenburg. Beyond Mecklenburg County there are concentrations of homes in this price range scattered among some small and medium-sized cities around the region (Gastonia, Concord, Rock Hill). They are also prevalent in several rural areas southeast and southwest of Charlotte (Anson, Chester, Cleveland counties).
Areas on this map where $50,000 to $99,000 homes are least concentrated form a relatively good picture of the suburban development pattern in the region. That area includes: northern Mecklenburg into southern Iredell (including parts of Catawba and Lincoln counties surrounding Lake Norman), southeastern Mecklenburg and the adjoining western half of Union County, and significant portions of western Cabarrus, northeastern York and the Lancaster County panhandle.
The second map (homes valued between $100,000 and $149,000) shows how concentrations shift farther away from the center of Charlotte to the north, east and southwest. Several areas of Mecklenburg County (within Charlotte) covered by the first two maps coincide with high foreclosure rates within the city of Charlotte. Homes in this value range are also seen in a line within Union County from the Mecklenburg County border, southeast through Stallings, Indian Trail and into Monroe. Other areas with these value concentrations are in Catawba and Iredell counties.
In the $150,000 to $199,000 map, the concentration pattern within Mecklenburg shifts again, moving further north into the University City area of Charlotte (north of W.T. Harris Boulevard and Mallard Creek Road). Another concentration appears in the southwestern corner of Mecklenburg County in the Steele Creek area. The median value for Mecklenburg County falls within this range ($185,100 as of the census estimate for 2006-2010).
Homes in the next map ($200,000 to $299,000) show a more suburbanized pattern with large areas of moderate concentrations in Iredell, Cabarrus and Union counties. Huntersville, Matthews and Mint Hill within Mecklenburg also have more homes in this range. The panhandle of Lancaster County has a concentration in this price range due to large developments like Sun City Carolina Lakes. This is notably higher than Lancaster County’s overall median value of $122,300 in the census estimate for 2006-2010.
Homes valued between $300,000 to $499,000 are concentrated in south Charlotte in a wedge from neighborhoods like Dilworth and Myers Park down Providence Road into Weddington and Marvin in Union County. Homes in this range also appear in between Mecklenburg and Iredell counties in Cornelius, Davidson and Mooresville. A cluster in this range is also clearly visible around Lake Wylie between Mecklenburg, York and Gaston counties. Concentration also exists in northeastern York County around developments like Baxter Village and Tega Cay as well as southeastern Gaston County. Other areas are just north of Concord Mills in Cabarrus County and the more rural northern Union County.
The $500,000 to $999,000 map shows a more focused concentration of homes north of Charlotte around Lake Norman and from south Charlotte into Union County. The highest concentrations north of Charlotte are in Iredell County on the Brawley School Road peninsula and in River Run in Davidson. Concentrations in Charlotte for this range are in south Charlotte neighborhoods including Eastover, Myers Park, Barclay Downs, Hembstead, Montibello, Ballantyne and Providence Country Club. Adjacent Union County concentrations are seen in the towns of Marvin, Weddington and Wesley Chapel.
Areas of concentration of $1 million or more homes are less common, and this map depicts only a few areas in Charlotte, including the Eastover and Myers Park neighborhoods. These homes are also found around Lake Norman, including the Point Lake and Golf Club in Iredell County, the Peninsula in Cornelius and some eastern Lincoln County lake-front tracts. The other prominent concentration is in Union County in the area that includes Firethorn and Longview golf communities in Marvin.
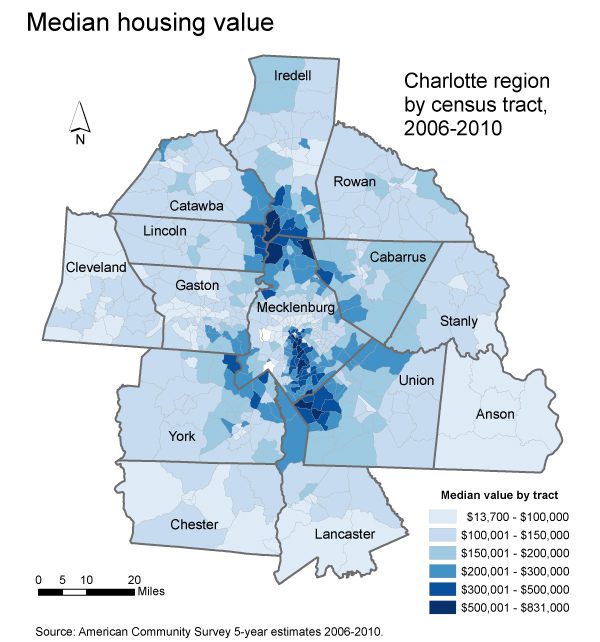
The median housing value map below provides a broader, aggregated view of home value distribution across the region. Clicking the button for the reference map shows cities, water and interstate highway locations.
Median home values
Median Housing ValueReference Map

By switching between the two maps above, you can see the towns and features (especially lakes) with concentrations of higher median home values. The median value map shows the pattern of concentration of higher value homes around the lake (Lake Norman) north of Charlotte and to a lesser extent from Belmont to Tega Cay southwest of Charlotte (Lake Wylie). The largest concentration of higher median value homes starts from the established in-town neighborhoods south of Charlotte’s center city and roughly follows Providence Road (N.C. 16) through the Ballantyne subdivision toward Marvin, Weddington and Waxhaw in Union County.
Cabarrus County’s values are more evenly dispersed relative to its median value ($164,100), compared to other high-growth counties like Union and York. Rural areas in Anson, Chester, Cleveland and Lancaster counties have lower median home values, but some rural areas in the region have relatively high values, such as northwestern Iredell and eastern Cabarrus and Rowan.
Mecklenburg County shows the clearest delineations of values, reflecting the economic segregation highlighted by the Pew report. Recent debates in Charlotte about strategies to address this issue have centered on capital projects and redevelopment. In recent discussions about the city’s purchase of Eastland Mall (a large, empty mall in east Charlotte), Charlotte Mayor Anthony Foxx said, “… In my opinion, the work that we have to do as a community is to realign our thinking about our city. … There is so much more tax base that we could grow if we can make parts of our city that are currently thought of as throw-away areas … into something that people want to invest in and believe in again.”
*The Census Bureau’s American Community Survey creates one-year, three-year and five-year estimates. Click here for more information on the differences in these estimates. Multiyear estimates describe the average characteristics for the time period covered. In this case, it is the average of the five-year period of 2006, 2007, 2008, 2009 and 2010. For more information on the survey’s housing unit selection, weights and sampling errors click here. Data in this analysis should be considered to indicate broader trends, not specific home values for any location.