For more than 50 years, the UNC Charlotte Urban Institute has studied the growth and challenges in our 14-county region. We’ve created plans and visions, conducted surveys and worked with community partners on issues ranging from homelessness to preserving our environmental resources.
Today, our work is focused on using integrated data, mixed-methods studies, data visualization, mapping and more to understand our fast-changing region. We collaborate with organizations in the community and faculty across UNC Charlotte.
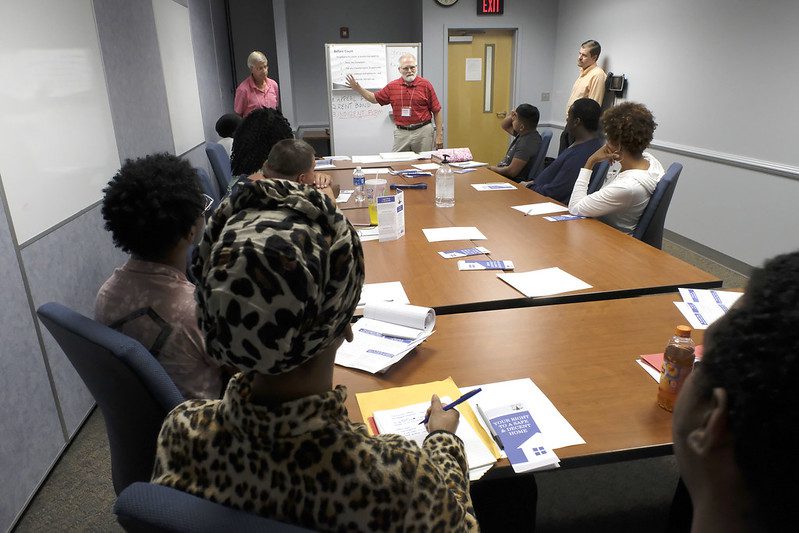
And we work to help people in the community understand our findings through a program of community engagements, live events and participation in panels, media appearances and our newsletter.
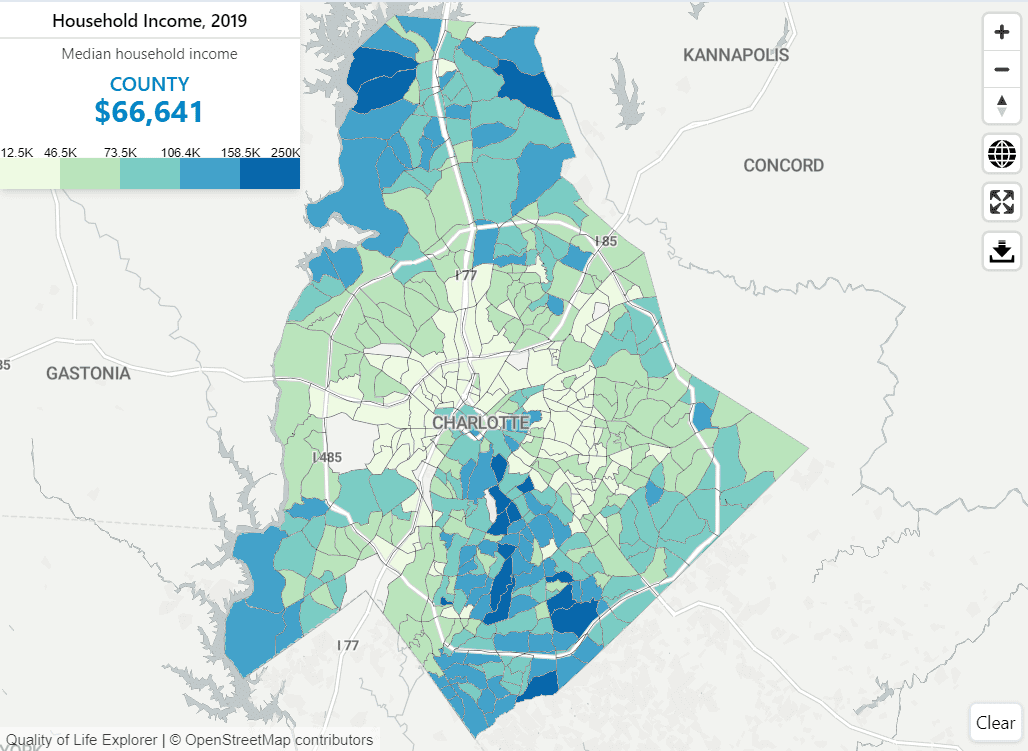
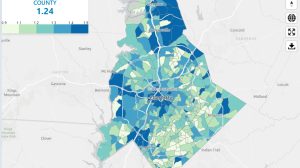
Our work includes grant-funded research projects such as the Carolinas Urban-Rural Connection and the Gambrell Faculty Fellows, mapping community indicators on the interactive Charlotte-Mecklenburg Quality of Life Explorer, collecting and using data from dozens of partners in the Charlotte Regional Data Trust and much more. Read more about what we do below.
Data
The Urban Institute uses qualitative and quantitative data, as well as interactive maps and graphics, to better understand our region and examine possible solutions to the challenges we face.