Minding the gap – CMS’ focused efforts highlighted.

While recent recognition lauds the efforts of Charlotte-Mecklenburg Schools to address disparities among schools, the reality of the work still to be done is clearly visible in newly released maps of various school measurements.
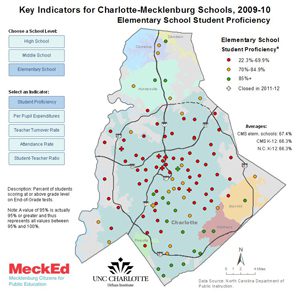
The maps, developed in a partnership between the UNC Charlotte Urban Institute and MecKEd, let users explore graduation rates, student proficiency, per-pupil expenditures, teacher turnover rates, attendance and student-teacher ratios at the school level. The maps show the degree to which schools in different parts of the county fare differently in these measures.
In September, CMS received the Broad Prize for Urban Education based on student academic gains and the reduction in the achievement gaps among minority and poor students. “By creatively supporting the most challenged schools with dollars and people and by empowering teachers to tailor instruction to student needs, Charlotte-Mecklenburg has produced truly impressive urban student achievement gap closures,” said Eli Broad, founder of The Eli and Edythe Broad Foundation, which awards the prize. “We congratulate everyone – teachers, administrators, parents, students and the entire community – involved in the district’s success.”
This national award highlights the emphasis being placed on addressing the links between poverty and students’ education outcomes in districts around the country. In Charlotte, differences among schools’ per-pupil spending reflect CMS’ deliberate strategy to target high-poverty schools with extra resources to try to improve students’ learning. The result is that schools in more affluent areas have lower expenditures per pupil compared to schools in high poverty areas.
 The maps let readers compare high schools, middle schools and elementary schools. Individual school names and information can be seen by moving your mouse over the school locations.
Looking at proficiency measures, you see clear geographic patterns, especially for elementary schools. Schools with lower proficiency scores are predominant in east and west Charlotte, where income levels are lower. High-proficiency schools tend to be clustered in south Charlotte and in the northern and eastern suburbs, where incomes are higher.
Comparing the elementary per-pupil expenditure map with the student proficiency map clearly shows the targeting of resources. One example is Ballantyne Elementary, in a high-income area near the southern county line, which shows a high proficiency score of 86.9 percent, yet its per-pupil expenditures are in the lowest category.
Another indicator, teacher turnover, can reflect many factors. It might indicate teachers avoiding the more difficult challenges of teaching in high-poverty schools. Or it might convey teachers’ dissatisfaction with a particular principal, or even a principal’s efforts to turn around a school by changing its teaching staff.
Bill Anderson, MeckEd’s executive director, said that “the point of these key indicators is not to focus on what school is failing in a particular area, but to call attention to the other pressures that are facing these schools. Many challenges are beyond the control of the school administration or any of the others in that school building.”
Categories and colors for display of the schools were developed jointly by staff at MeckEd and researchers at the UNC Charlotte Urban Institute. Generally, the middle (yellow) category contains schools grouped around the mean or average for that data item. So, schools in that category fall somewhat above or below the district average. Categories for high school graduation and student proficiency were suggested by MeckEd to emphasize the wide gaps in those areas.
Anderson explained, “Obviously we would like to see 100 percent of our students graduate. The categories we suggested for high school graduation maps are designed to highlight the differences between schools. We want to help people understand that in locations that have concentrations of poverty many things are more difficult.”
Anderson sited his organization’s commitment to inform, educate and engage the community around the issues of public education. “Our goal is to be seen as an expert in the field of education that presents unbiased, impartial, correct information.”
These maps highlight the real challenges that remain for CMS, and the extent of the district’s efforts to address them. Continuing the success that CMS has seen so far may hinge on the community commitment to these efforts in challenging economic times.
The maps are posted on websites for both the UNC Charlotte Urban Institute and MeckEd. Click here for story/maps on MeckEd’s website.
MeckEd (Mecklenburg Citizens for Public Education) is a nonprofit group founded to inform, educate and engage the public around public education issues. It has recently been involved providing information to the community on the upcoming school board elections. Click here for more information. On Oct. 19 MeckEd is hosting a debate among the 13 candidates running for at-large seats on the Charlotte Mecklenburg Board of Education. The debate will be at 7 p.m. in the Pease Auditorium on the main campus of Central Piedmont Community College. To RSVP, see the MeckEd website.
The UNC Charlotte Urban Institute collaborates with community partners to collect, analyze and publish data through the institute’s Regional Indicators website. New, online sites are scheduled for release soon for The Urban League of Central Carolinas and the United Way of Central Carolinas. To learn more about this project and the participating organizations, click here.