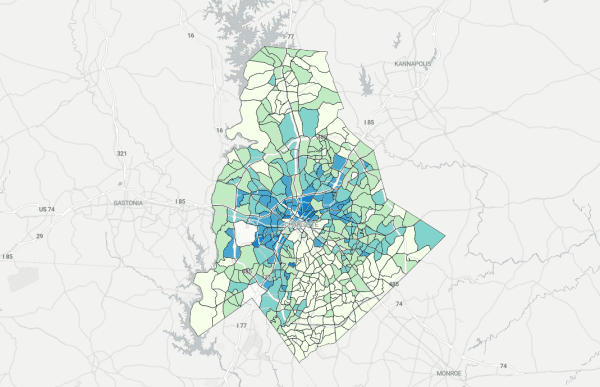
New maps show Charlotte demographic trends

New data on the Quality of Life Explorer mapping tool paint a picture of how demographics are changing across Charlotte and Mecklenburg County, as well as other measures such as bicycle friendliness, voter participation and average water consumption.
The Quality of Life Explorer is a joint tool of Mecklenburg County, the city of Charlotte and the Urban Institute, mapping dozens of variables down to the neighborhood level in an interactive, embeddable format. The new maps include the most up-to-date data, from either 2018 or 2017, depending on the source. Updated maps include demographich characteristics such as race, age and ethnicity; measures of how we live such as home ownership rates, median rent and percentage of people who commute to work solo; and variables such as crime rates (violent and property), food and nutrition service use, and calls for animal care and control.
You can see a sample of the new maps below. Maps with updated information are marked “new” in the Quality of Life tool (If you don’t see the updated maps, try clearing your browser’s cache or using an incognito window).