One county, different views on opportunity

Since the highly contentious 2016 election cycle, the growing divide between Americans of different backgrounds on many issues has been well documented. But do those divides show up between residents of a single city?
The UNC Charlotte Urban Institute’s most recent Annual Survey of Mecklenburg County provides insight into how such differences show up on a local scale. The survey found significant differences among white Mecklenburg County residents in their perceptions of the degree of respect and opportunity given to people of other races. Specifically, white Democrats were significantly more likely than white Republicans to believe that people of other races were treated with less respect and experienced fewer opportunities than themselves. Similarly, white college graduates were more likely than those without a college degree to believe they were given greater respect and opportunity than people of other races.
While national reports have frequently tied differences in viewpoints to different locales (such as the “urban/rural divide” discussed in The Atlantic, the New York Times, and the Washington Post,) this survey shows that significantly different viewpoints also exist within one urban county.
The UNC Charlotte Urban Institute has conducted its Annual Survey of Mecklenburg County for more than 30 years. Each year, the institute combines questions from local nonprofit and government agencies with some of its own questions to gauge local opinions on various topics. This year’s survey took place in January 2017 with a random sample of 400 Mecklenburg residents.
Survey participants were asked whether they believed people of different races and ethnicities than themselves had better, the same, or worse opportunities than they did for jobs, education, and health care. Participants were also asked whether they believed people of different races and ethnicities were treated with more, the same, or less respect than they were.
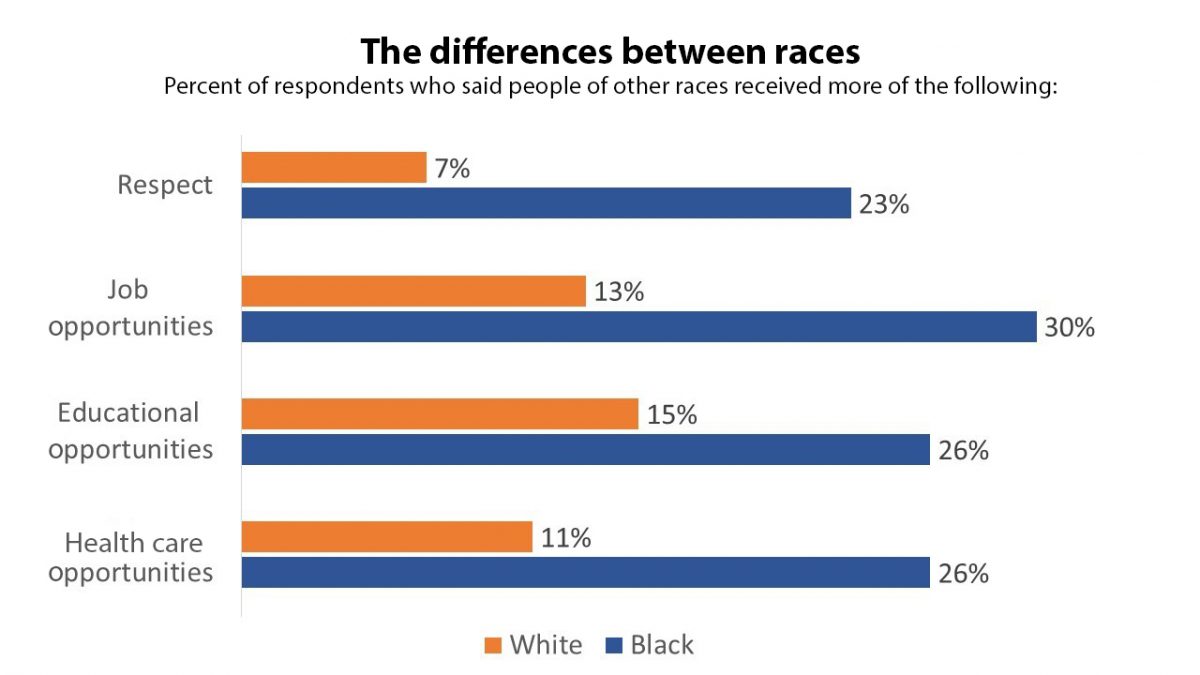
On all four questions, black residents were more likely than white ones to say people of different races faced better circumstances than they did. For example, 30 percent of black respondents said they thought people of different races had better job opportunities, while only 13 percent of white respondents said they thought this. Similarly, while only 7 percent of white respondents said they thought people of different races were treated with more respect than they were, 23 percent of black respondents said they felt this way.

Source: UNC Charlotte Urban Institute Annual Survey
Because the questions asked respondents to compare themselves to people of races different from their own, the most telling distinctions exist between people of the same race. Because of lower numbers of black respondents for this survey, it is not possible to do a detailed analysis of black residents that would achieve statistically significant results. But the survey results do allow white residents’ responses to be analyzed by education level and political affiliation.
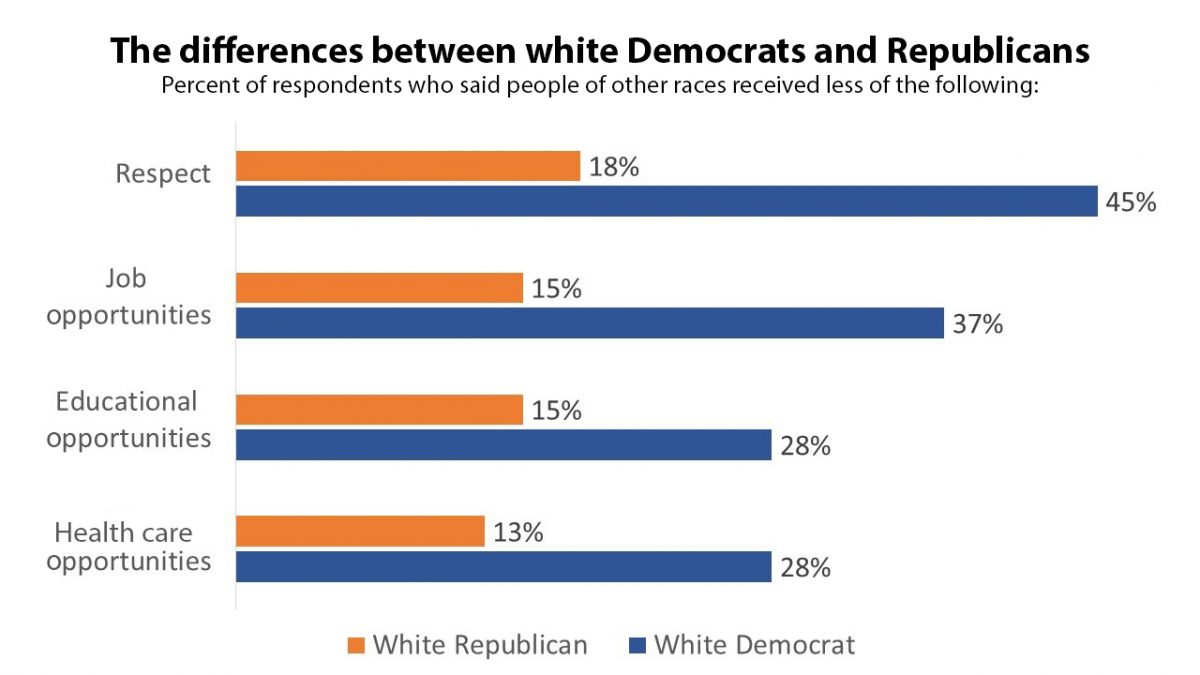
In all cases, white Democrats were more likely than white Republicans to say that people of other races faced more difficult circumstances than they did. While 37 percent of white Democrats said people of other races had worse job opportunities than they did, only 15 percent of white Republicans said this. Similarly, 28 percent of white Democrats said people of other races received worse educational opportunities, compared to 15 percent of white Republicans.
The largest difference between white Democrats and Republicans came in the degree of respect they said people of other races received. Nearly half (45 percent) of white Democrats said people of other races were generally treated with less respect than themselves, compared to 18 percent of white Republicans.

Source: UNC Charlotte Urban Institute Annual Survey
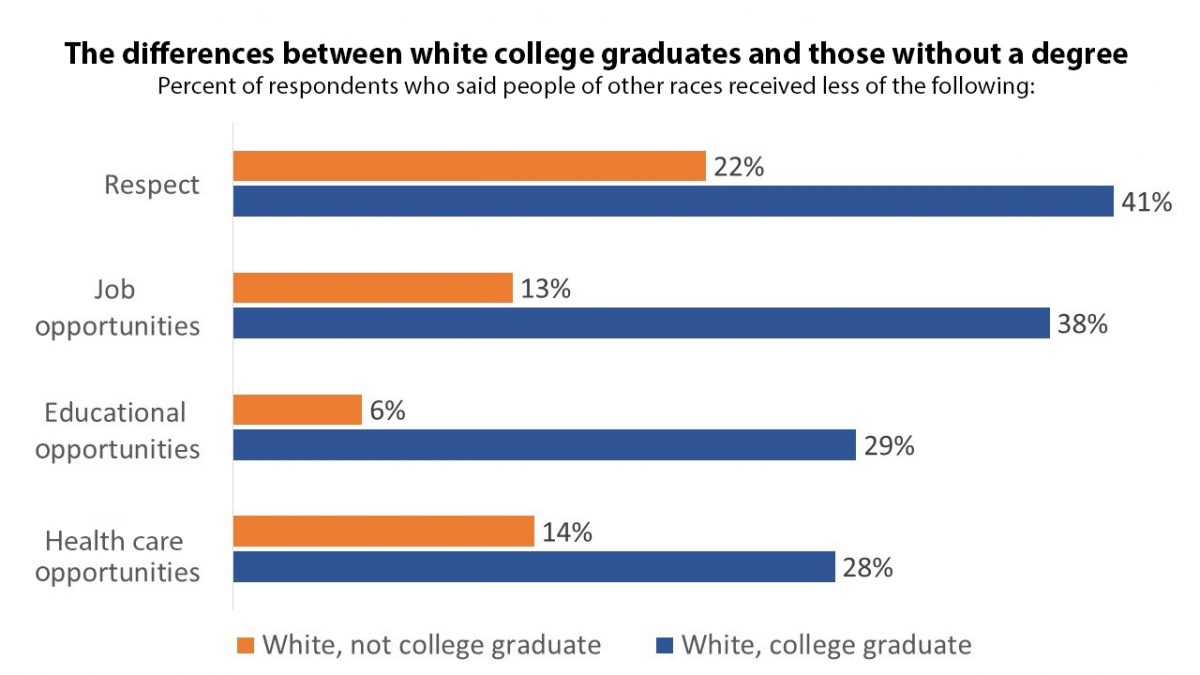
The survey revealed similar differences between whites with a college degree and those without one. While 38 percent of white college graduates said they had better job opportunities than people of other races, just 13 percent of whites without a degree said that. Moreover, 29 percent of college graduates said people of other races had worse educational opportunities, compared to 6 percent of whites without a degree. As above, nearly half of those (41 percent) with a college degree said people of other races were generally treated with less respect than they were, while only 22 percent of those without a degree said they felt that way.

Source: UNC Charlotte Urban Institute Annual Survey
Although the survey’s sample size was relatively small, the results are consistent with those from other sources.
For example, in a recent national survey, the Pew Research Center found that 78 percent of white Democrats said the country needed to continue making changes to achieve racial equality, whereas 54 percent of white Republicans said the country had already made the changes necessary for blacks and whites to have equal rights.
The Pew survey also found that 47 percent of whites with a college degree believed their race had made it easier for them to succeed, compared to 31 percent of whites with some college and 17 percent of whites with no college experience saying that.
The UNC Charlotte Urban Institute Annual Survey helps show that such national disparities also exist within the confines of a smaller locale. It’s important to point out that in all the cases analyzed, a majority of respondents within each group said people of other races received at least the same level of opportunities and respect as they did. Nevertheless, all the reported differences were statistically significant, suggesting people of some groups were significantly more likely to have said this was the case than were others.
This survey of Mecklenburg County reminds us that we need not cross major borders to discover people with meaningfully different perspectives from our own. Those differences can exist within our own cities and neighborhoods.
SURVEY METHODS
The UNC Charlotte Urban Institute Annual Survey was conducted via a random telephone sample of 400 Mecklenburg County residents using both land lines and cell phones. All survey data have been weighted based on demographics to more accurately approximate the survey results to the larger Mecklenburg County population. All differences reported in this article were determined to be statistically significant. For more information on the survey, please contact Diane Gavarkavich, director of research services, at d.gavarkavich@charlotte.edu or 704-687-1198.
Thomas Swiderski is a social research specialist at the UNC Charlotte Urban Institute. Reach him at tswiders@charlotte.edu.
Thomas Swiderski