Race and Ethnicity

The impact of the racial wealth gap in Charlotte-Mecklenburg
This is the first in a series, based on a report by the Charlotte Urban Institute. Read Part 2 here. The report was compiled with support from Bank of America, which partners with the Charlotte Urban Institute and the Charlotte Regional Data Trust on research that provides insight into community initiatives. By James E. Ford, […]

What made our city so divided? This book traces the roots
The new release of a classic book about how Charlotte became so divided sheds light on the city’s enduring inequalities, and why those disparities are far from accidental. Whether you have more time on your hands without a daily commute or you’re looking for something to read that’s not about the novel coronavirus, UNC Press’s […]

One month into the coronavirus crisis, food and housing insecurity rise
Since the coronavirus lockdowns began, Mecklenburg’s resource helpline has seen housing assistance requests jump 219% and food assistance jump 747%. These numbers are an indication of the dramatic impacts we’re seeing unfold on Charlotte-Mecklenburg’s economy. It has been more than one month since Governor Roy Cooper declared a state of emergency to combat the spread […]

Immigrants play a big role in Charlotte’s growth, new study shows
Almost one in six Mecklenburg residents were born outside the U.S., and immigrants make an outsized contribution to the local economy and many key industries. That’s according to a new study examining the economic impact of immigration in the “Gateways for Growth” series. Conducted by the pro-immigration think tank New American Economy, in partnership with […]

A new local racial equity analysis tool highlights disparities in homelessness
In January 2019, the U.S. Department of Housing & Urban Development (HUD) released a Continuum of Care (CoC) Racial Equity Analysis Tool to help communities across the United States understand who is accessing local CoC systems and what outcomes are being achieved. Mecklenburg County Community Support Services, in partnership with UNC Charlotte Urban Institute, adapted […]

One county, different views on opportunity
Since the highly contentious 2016 election cycle, the growing divide between Americans of different backgrounds on many issues has been well documented. But do those divides show up between residents of a single city? The UNC Charlotte Urban Institute’s most recent Annual Survey of Mecklenburg County provides insight into how such differences show up on […]

Good cop or bad cop? #BlackLivesMatter or #AllLivesMatter?
[highlightrule]What’s going on in our nation? Why? And what should we do about it?[/highlightrule] What’s going on in our nation? Though most of our systems aspire to fairness, people of color consistently experience disparate outcomes, compared to Whites. Racial disproportionality occurs across all systems – education, child welfare, health care, housing, employment, banking and finance […]

Snapshot of poverty in Mecklenburg County
Poverty is a critical social and public policy issue nationwide, but there is considerable variation by state, municipality, and neighborhood. What is the state of poverty in our community? How pervasive is it? How deeply is it ingrained? The UNC Charlotte Urban Institute is working with the Charlotte-Mecklenburg Opportunity Task Force to present data that […]

High school graduation rate demographics by school for 2013-14
This week’s map shows high school graduation rates at the school level and presents the latest numbers for various demographic groups. Choose a district and demographic group from the menu to the right of the map to see the rates for students of a particular race/ethnicity, sex, socio-economic status, English proficiency, or gifted status. Schools […]

2013-2014 High School Graduation Rate Demographics
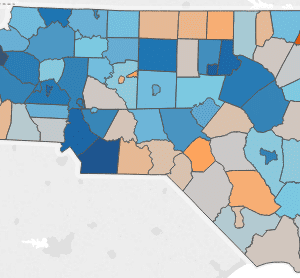
This week’s map continues exploring high school graduation rates across the state and presents the latest numbers for various demographic groups. Choose from the menu below the map to see the rates for students of a particular race/ethnicity, sex, socio-economic status, English ability, or gifted status. Districts in blue are above the state average for […]